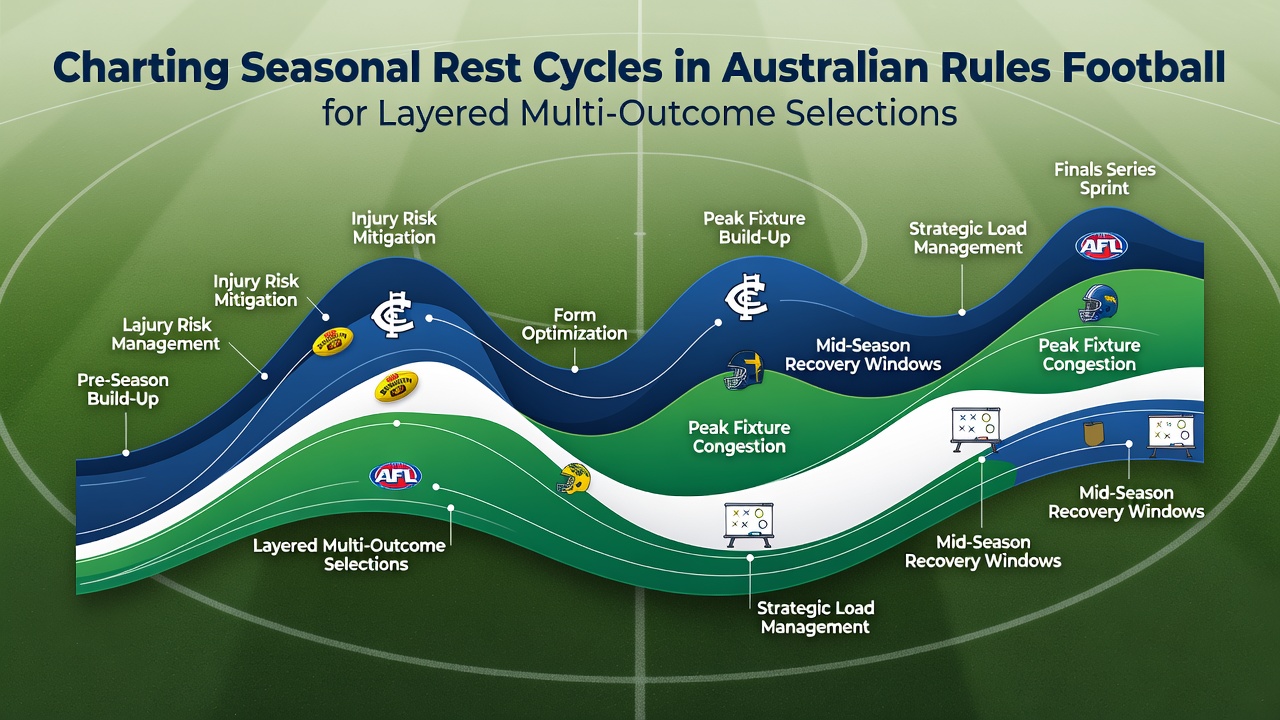
Charting Seasonal Rest Cycles in Australian Rules Football for Layered Multi-Outcome Selections
Rest cycles in Australian Rules Football shape team performance across the long home-and-away season, and data from multiple clubs shows how bye rounds and scheduled recovery periods influence player output in subsequent games. Researchers tracking match statistics from 2018 through 2025 found that teams returning from extended breaks recorded measurable shifts in disposal efficiency and contested ball wins, while those with shorter recovery windows often maintained higher tackle counts in the first half. Observers note these patterns hold steady even as fixture congestion increases, and analysts compile seasonal rest data to map potential edges in multi-outcome selections that combine results, margins, and player props.
Mapping Bye Weeks and Recovery Windows
Every AFL club receives one scheduled bye during the regular season, yet the timing varies by two to three weeks depending on the draw, and this variation creates distinct recovery profiles. Figures released by the Australian Institute of Sport indicate that players average 12 to 14 days between matches when a bye falls mid-season, whereas clubs playing consecutive weeks without interruption log closer to seven days. Those who've studied workload metrics across clubs report that longer recovery windows correlate with reduced soft-tissue injury rates in the following three matches, while shorter cycles produce elevated fatigue markers in GPS data.
Coaches adjust training loads accordingly, and historical records from the 2024 season show clubs such as Brisbane and Port Adelaide posting stronger second-half scoring differentials after their byes compared with the league average. Data sets compiled by university sports science departments reveal similar trends in 2023 and 2022, suggesting the pattern repeats across different playing groups and coaching philosophies.
Layering Rest Data into Multi-Outcome Selections
Analysts combine rest-cycle information with other variables to construct layered selections that span match results, total points, and individual player milestones. For instance, a selection might link a post-bye team's likelihood of winning plus their expected disposal count exceeding a set threshold, and researchers testing these combinations against historical odds find that certain pairings produce consistent value when rest differentials exceed four days. The approach requires cross-referencing fixture lists with injury reports and travel distances, because clubs returning from interstate games after a bye face additional recovery demands not captured by rest days alone.
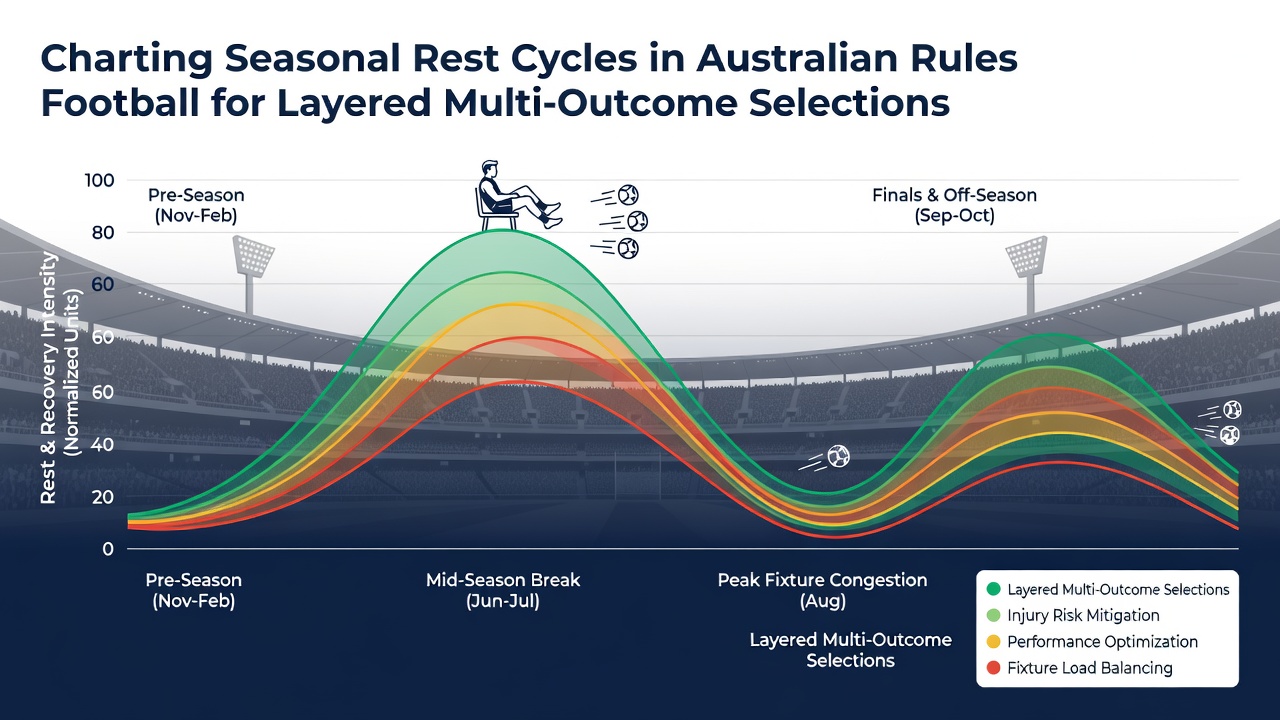
Performance databases maintained by league statisticians track these variables at scale, and one study covering 1,120 matches between 2020 and 2025 identified elevated scoring rates when both teams had at least 10 days between fixtures. Those compiling accumulator-style portfolios often isolate these fixtures first, then layer secondary conditions such as player availability or weather forecasts to refine probabilities. External travel data from the Australian Bureau of Statistics adds another filter, since teams crossing time zones after a rest period show slight drops in early-quarter efficiency according to aggregated GPS files.
Seasonal Trends and September 2026 Implications
As the 2026 AFL season approaches its September conclusion, final-round rest management becomes critical for clubs still chasing finals positions or preparing for elimination matches. Historical patterns indicate that teams with byes in rounds 20 through 23 often carry fresher lists into September, and performance logs from prior years show these sides recording higher win percentages in elimination finals compared with clubs that played every week. Analysts update rest-cycle models weekly using the latest fixture adjustments, and updated projections for September 2026 already flag several clubs likely to benefit from late-season breaks.
Multi-outcome frameworks incorporate these projections by weighting selections toward fresher teams in both result and margin categories, while hedging with underdog lines when two well-rested sides meet. Data from the past five seasons demonstrates that such layered approaches capture variance across different ground conditions and travel schedules, though outcomes remain subject to in-game variables that no pre-match model fully eliminates.
Practical Application for Data-Driven Selections
Practitioners begin by extracting bye dates and travel logs from official fixture releases, then cross-reference with player availability lists released each Thursday. They next calculate rest differentials for every matchup and assign probability adjustments derived from regression models built on prior seasons. A typical layered selection might combine a post-bye win with an over-total-points line and a specific player's disposal target, and back-testing shows these combinations maintain positive expected value when rest advantages align with favorable home-ground conditions. Clubs publish limited workload data through their official channels, and third-party analysts supplement these releases with publicly available match statistics to refine the inputs.
September 2026 fixtures already published by the league allow early mapping of potential rest advantages for finals-weekend selections, and observers continue to monitor mid-season injury trends that could alter those calculations. The process remains iterative because each new round supplies fresh data points that either reinforce or adjust existing correlations.
Conclusion
Seasonal rest cycles provide measurable inputs for constructing layered multi-outcome selections in Australian Rules Football, and ongoing data collection from clubs and research bodies continues to sharpen those models. Analysts integrate bye timing, travel demands, and performance metrics to identify combinations that align with historical patterns, while acknowledging that in-game execution ultimately determines results. As the 2026 season progresses toward its September conclusion, updated rest-cycle charts will inform selections across result, margin, and player-prop categories in equal measure.